From real-time alerts to long-term proof.

One platform across every time horizon: catch congestion the moment it starts, understand why it keeps happening, and prove your interventions are working.

Book a demo Explore the platform
The TraffiCure dashboard showing city-wide KPIs, journey-time reliability, level of service, peak comparison, and the day's top congestion hotspots

Catch it as it happens

Live alerts and an at-a-glance pulse, refreshed every two minutes across your whole network.

The Alerts feed: Active and Resolved tabs, a list of congestion alerts on the left, and a live traffic map colour-coded by delay on the right
Alerts

Know the moment a road slows down

A live feed of every active and resolved incident across your network, beside a map colour-coded by delay. See the road, the delay, the current speed, and how long it has been building, then drill into any alert for its full speed timeline.

  • Live and Resolved tabs across the whole road network
  • Speed-trend graphs: actual vs typical vs free-flow
  • Per-segment history to tell chronic from one-off
  • Filter and sort by severity, delay, duration; search by road
The CityPulse board of single-question widgets, each showing a headline value with a colour edge
CityPulse

Your network at a glance

A customisable board of single-question widgets, each a headline number with a colour edge that reads good or bad instantly. Use the ready-made widgets, build your own, or describe one in plain English and watch the assistant draft it live.

  • Default, custom, and AI-built widgets in one board
  • Headline value with refresh cadence and one-line summary
  • Click any widget for charts, tables, filters and PDF export
  • Build tab: describe a metric, preview it, save it

Understand why it keeps happening

Drill from the whole network down to a single junction approach, and see whether a delay is recurrent or a one-off.

The Analytics deep-dive view with 24-hour speed profile, delay index, and reliability metrics for a corridor
Analytics

Drill into any corridor or segment

The deep-dive view for any road or route. See 24-hour speed profiles, 7-day delay indexes, journey-time reliability, and whether delay is recurrent or one-off, then ask the built-in assistant about what you are looking at.

  • Corridor and segment views with drill-down
  • 24-hour speed profile and 7-day delay index
  • Delay classification: recurrent vs non-recurrent
  • Busy-hours heatmap by day-of-week and hour
The Area Analysis spatial heatmap dividing the city into cells coloured by congestion, with a ranked worst-areas list
Area Analysis

See congestion as a city heatmap

Split the city into localities, pin codes, or a hex grid and paint it by speed, congestion, delay, or incidents. The worst fifteen areas rank on the right, and a playback slider scrubs through any hour of the last seven days.

  • Locality, pin-code, or hex-grid views
  • Colour by speed, congestion, delay, or incidents
  • Top 15 worst-area ranking with auto pattern insight
  • Playback through any hour of the past week
The Junctions view listing intersections with speed, delay and approach counts, and a map of junction markers
Junctions

Every intersection, approach by approach

Each signalled junction broken down by its incoming arms. Compare AM and PM performance per approach, read 30-day hour-of-day heatmaps, and drill into a single approach for its speed and weekly pattern.

  • Junction list with speed, delay, approach and alert counts
  • AM vs PM performance by approach
  • 30-day hour-of-day heatmap per approach
  • Weekday vs weekend pattern breakdown
The Route Monitoring view showing a custom route on the map with travel time, delay and segment breakdown
Route Monitoring

Track the routes your city cares about

Stitch roads into named routes, VIP corridors, ambulance paths, school runs, by searching or clicking the map. Each route snaps to the network and is tracked for travel time, delay, reliability, and a road-by-road breakdown.

  • Build routes by waypoint search or map click
  • Travel time, delay, and reliability per route
  • Live mode or historical playback through any day
  • Segment-by-segment performance breakdown

Prove it, and brief your city

Turn the data into board-ready reports and plain-language answers anyone on your team can pull.

The Reports view with auto-generated daily, weekly and monthly reports and an embedded PDF viewer
Reports

Board-ready reports, generated for you

Daily briefings, weekly health reports, and monthly leadership summaries build themselves. Need a comparison? Pick two date ranges and up to twelve roads and the platform assembles a side-by-side PDF.

  • Auto daily, weekly, and monthly reports
  • On-demand compare reports: two ranges, up to 12 roads
  • Searchable report history with status badges
  • Embedded PDF viewer, download, and share
The Ask assistant answering a question with hero numbers, charts and a map of the road network
Ask

A conversation with your traffic data

Ask questions in plain language and get back hero numbers, charts, maps, and narratives. Upload a spreadsheet to cross-reference against live data, then download the answer as a polished PDF, Word, or Excel file.

  • Natural-language questions across the whole platform
  • Answers with stats, charts, maps, and breakdowns
  • Upload Excel, CSV, PDF, or Word to bring in your data
  • Download answers as PDF, Word, or Excel

Put to work in the control room

Four ways city teams turn the live feed into decisions, from signal timing to budget-ready simulation.

Signal timing optimization

Reactive policing becomes proactive, and signals adapt to today's traffic, not last year's survey.

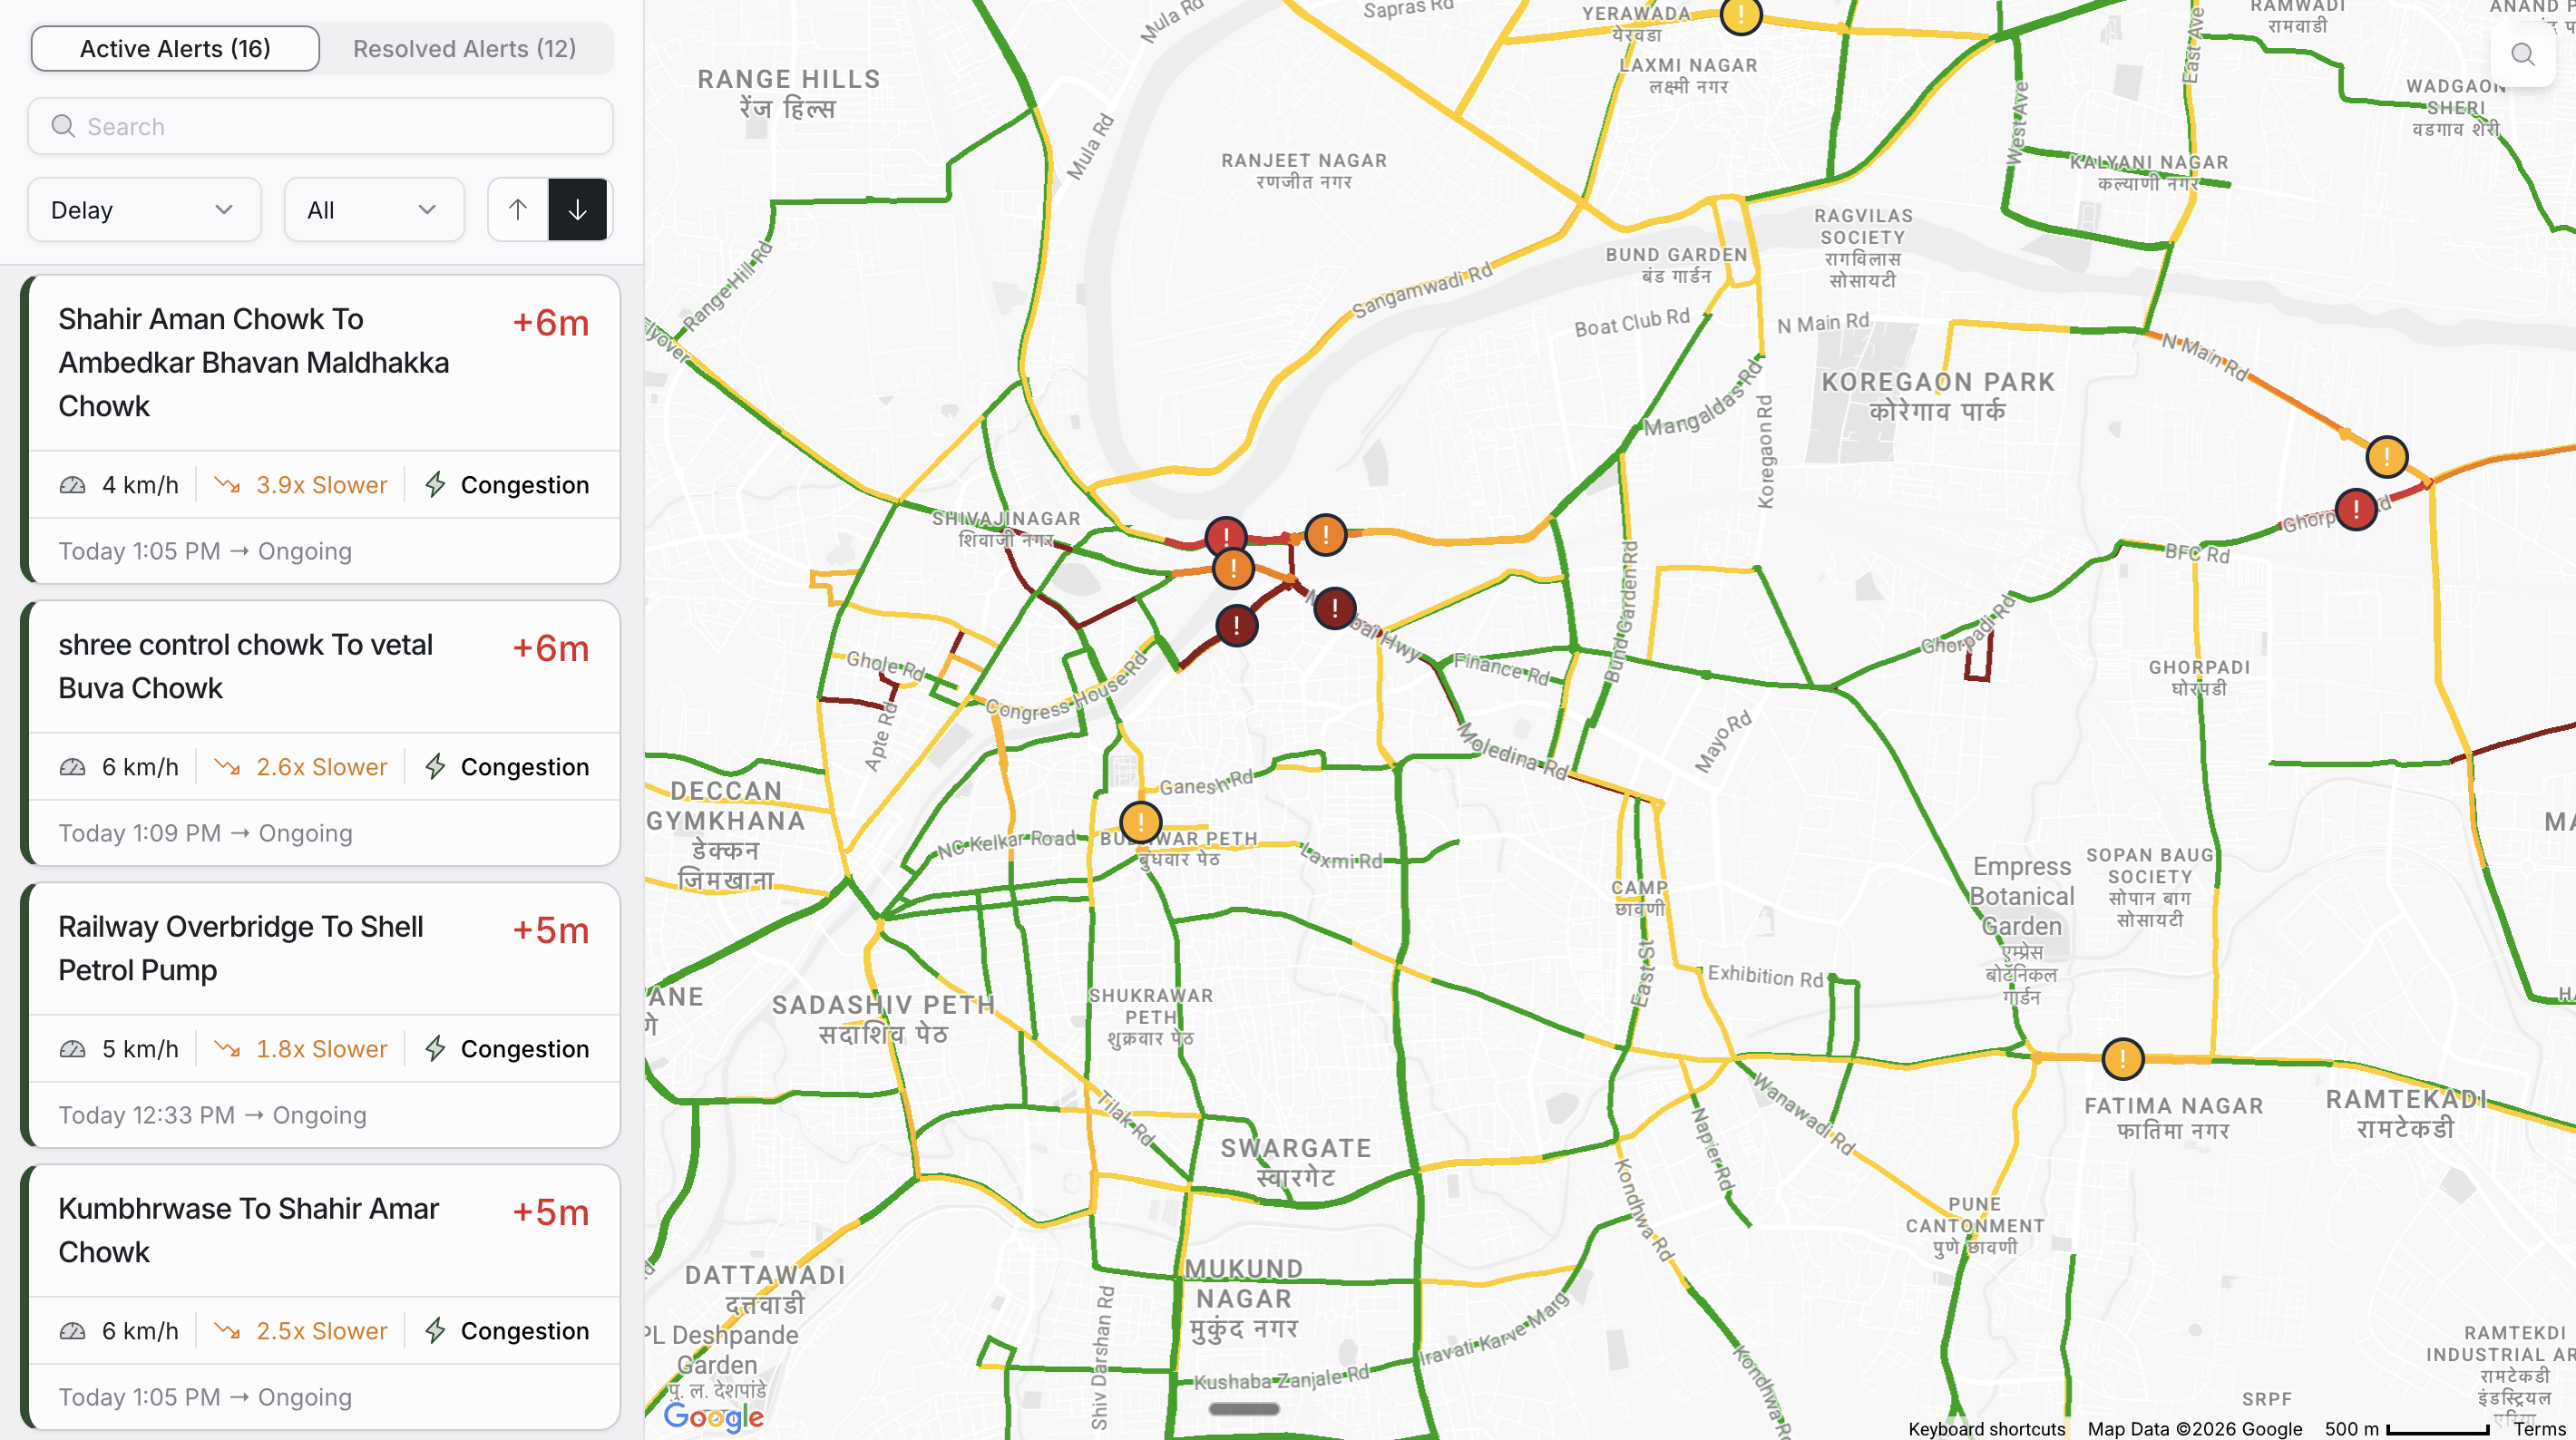
  • Live alerts on mobile and web. Officers in the field and the control room share one live view.
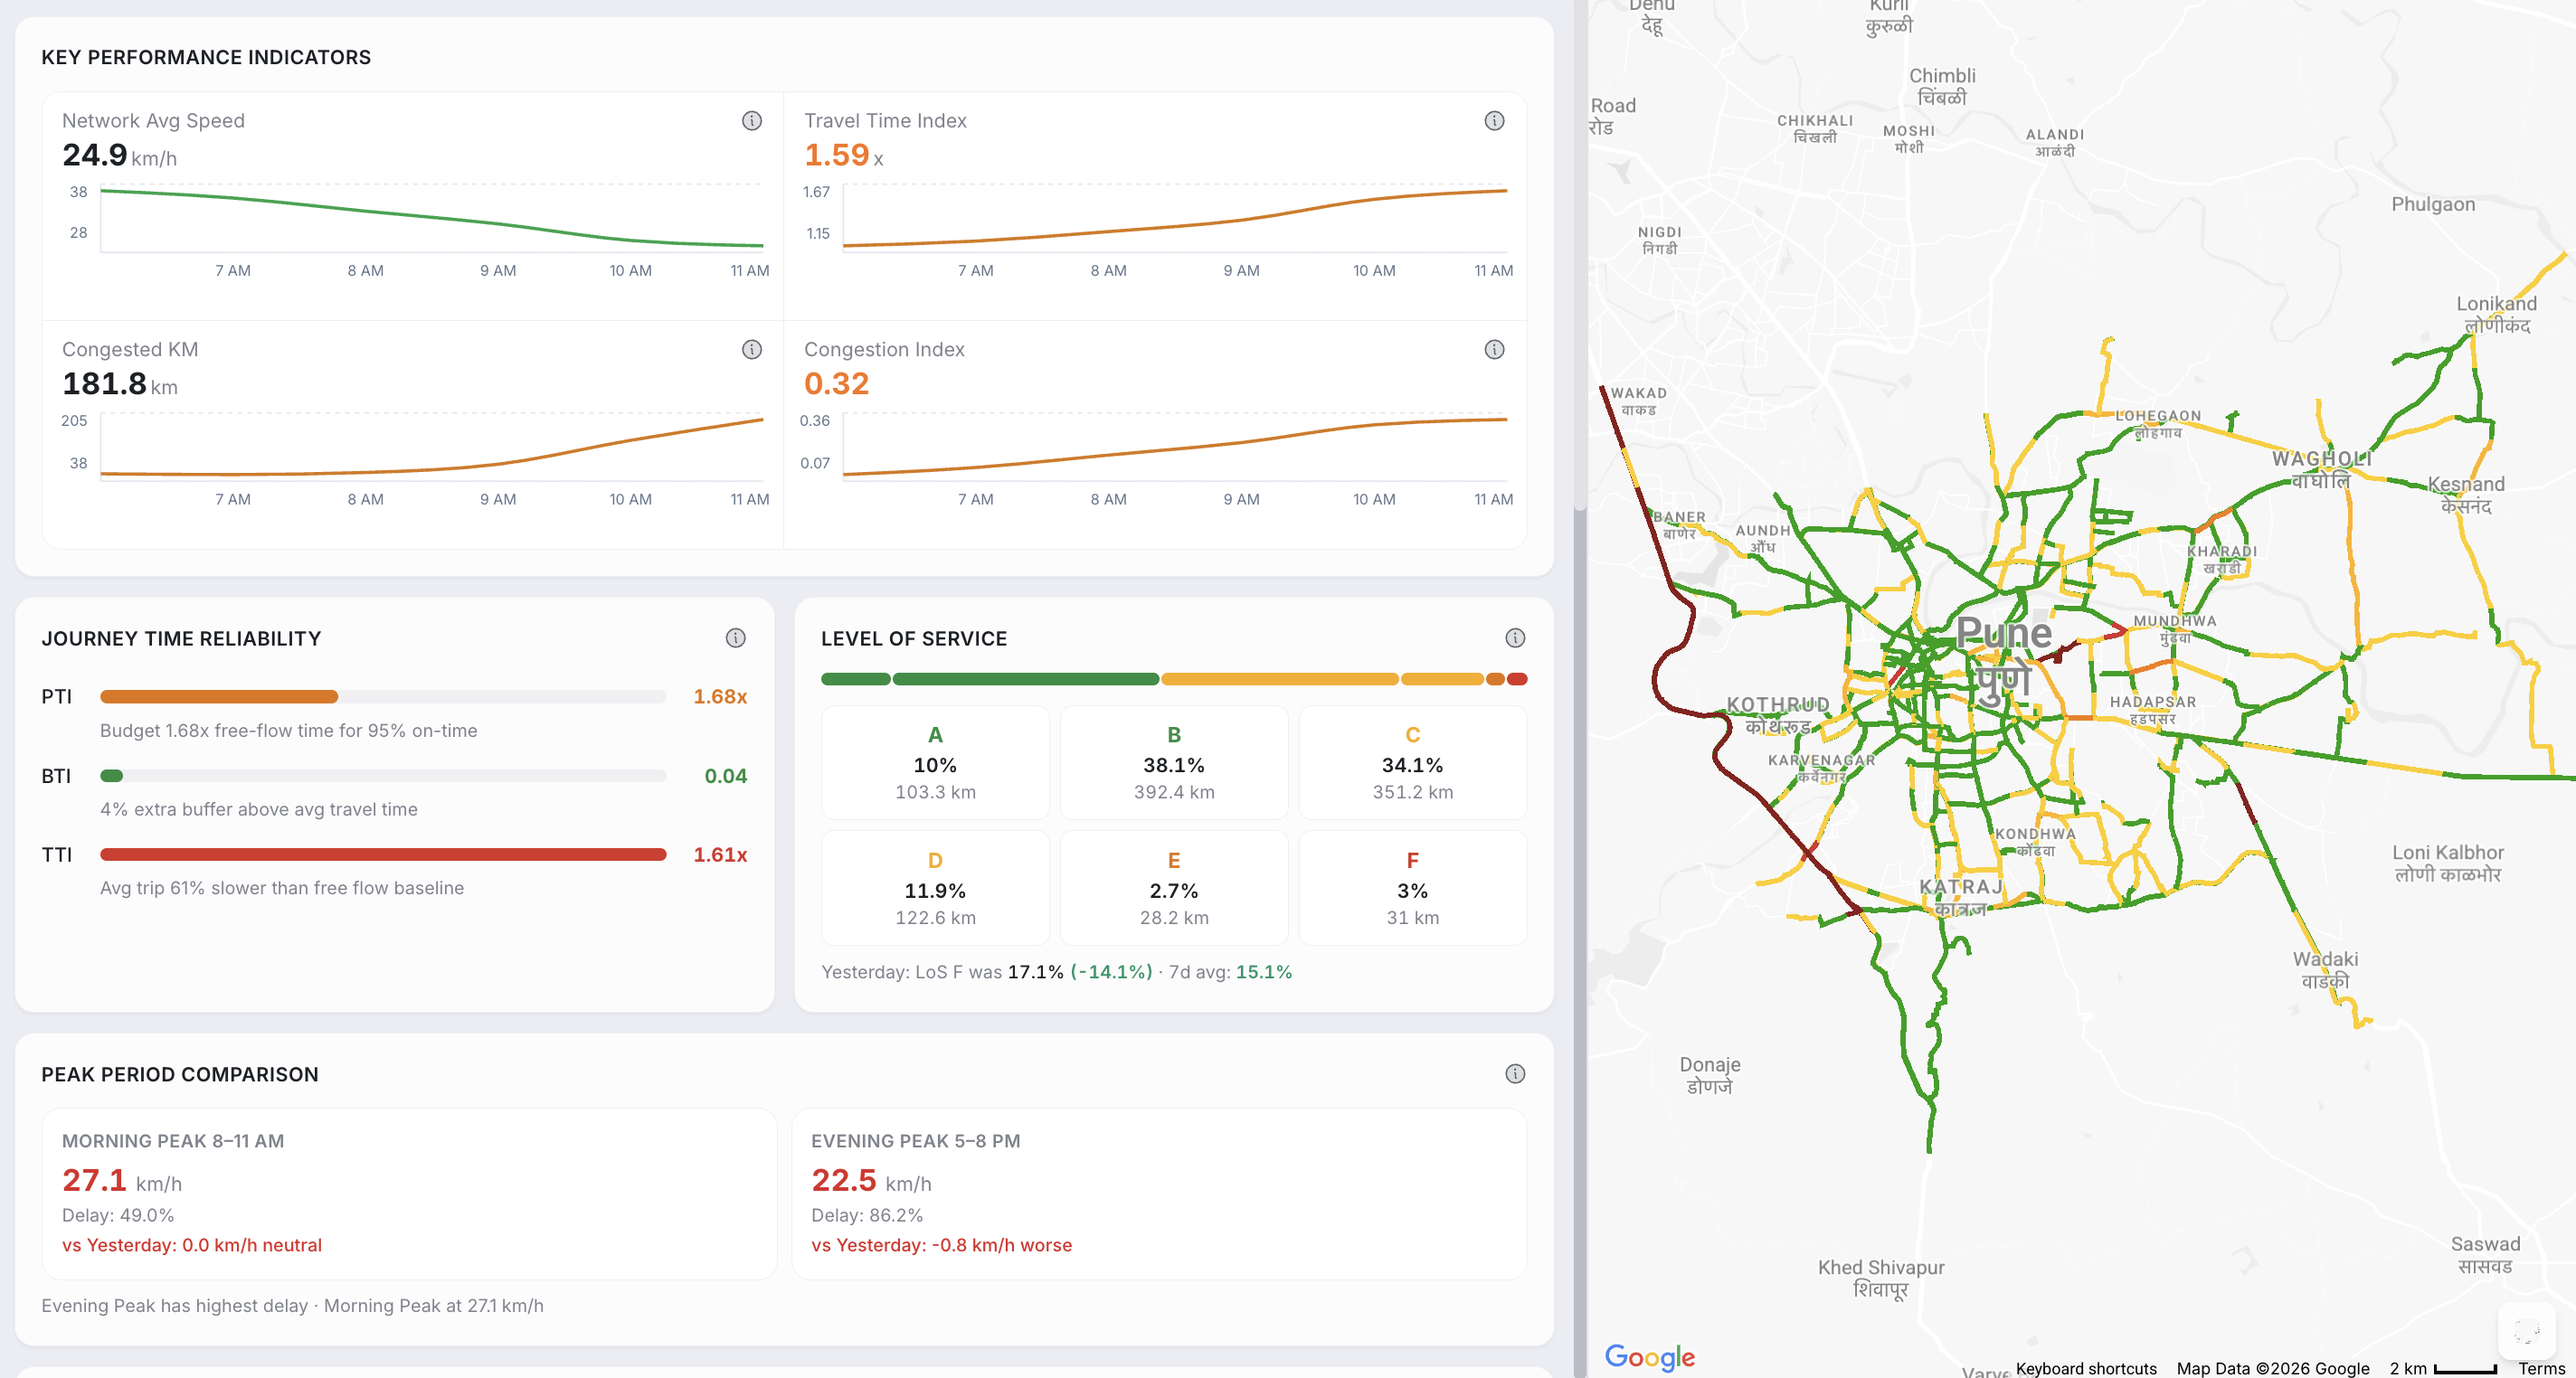
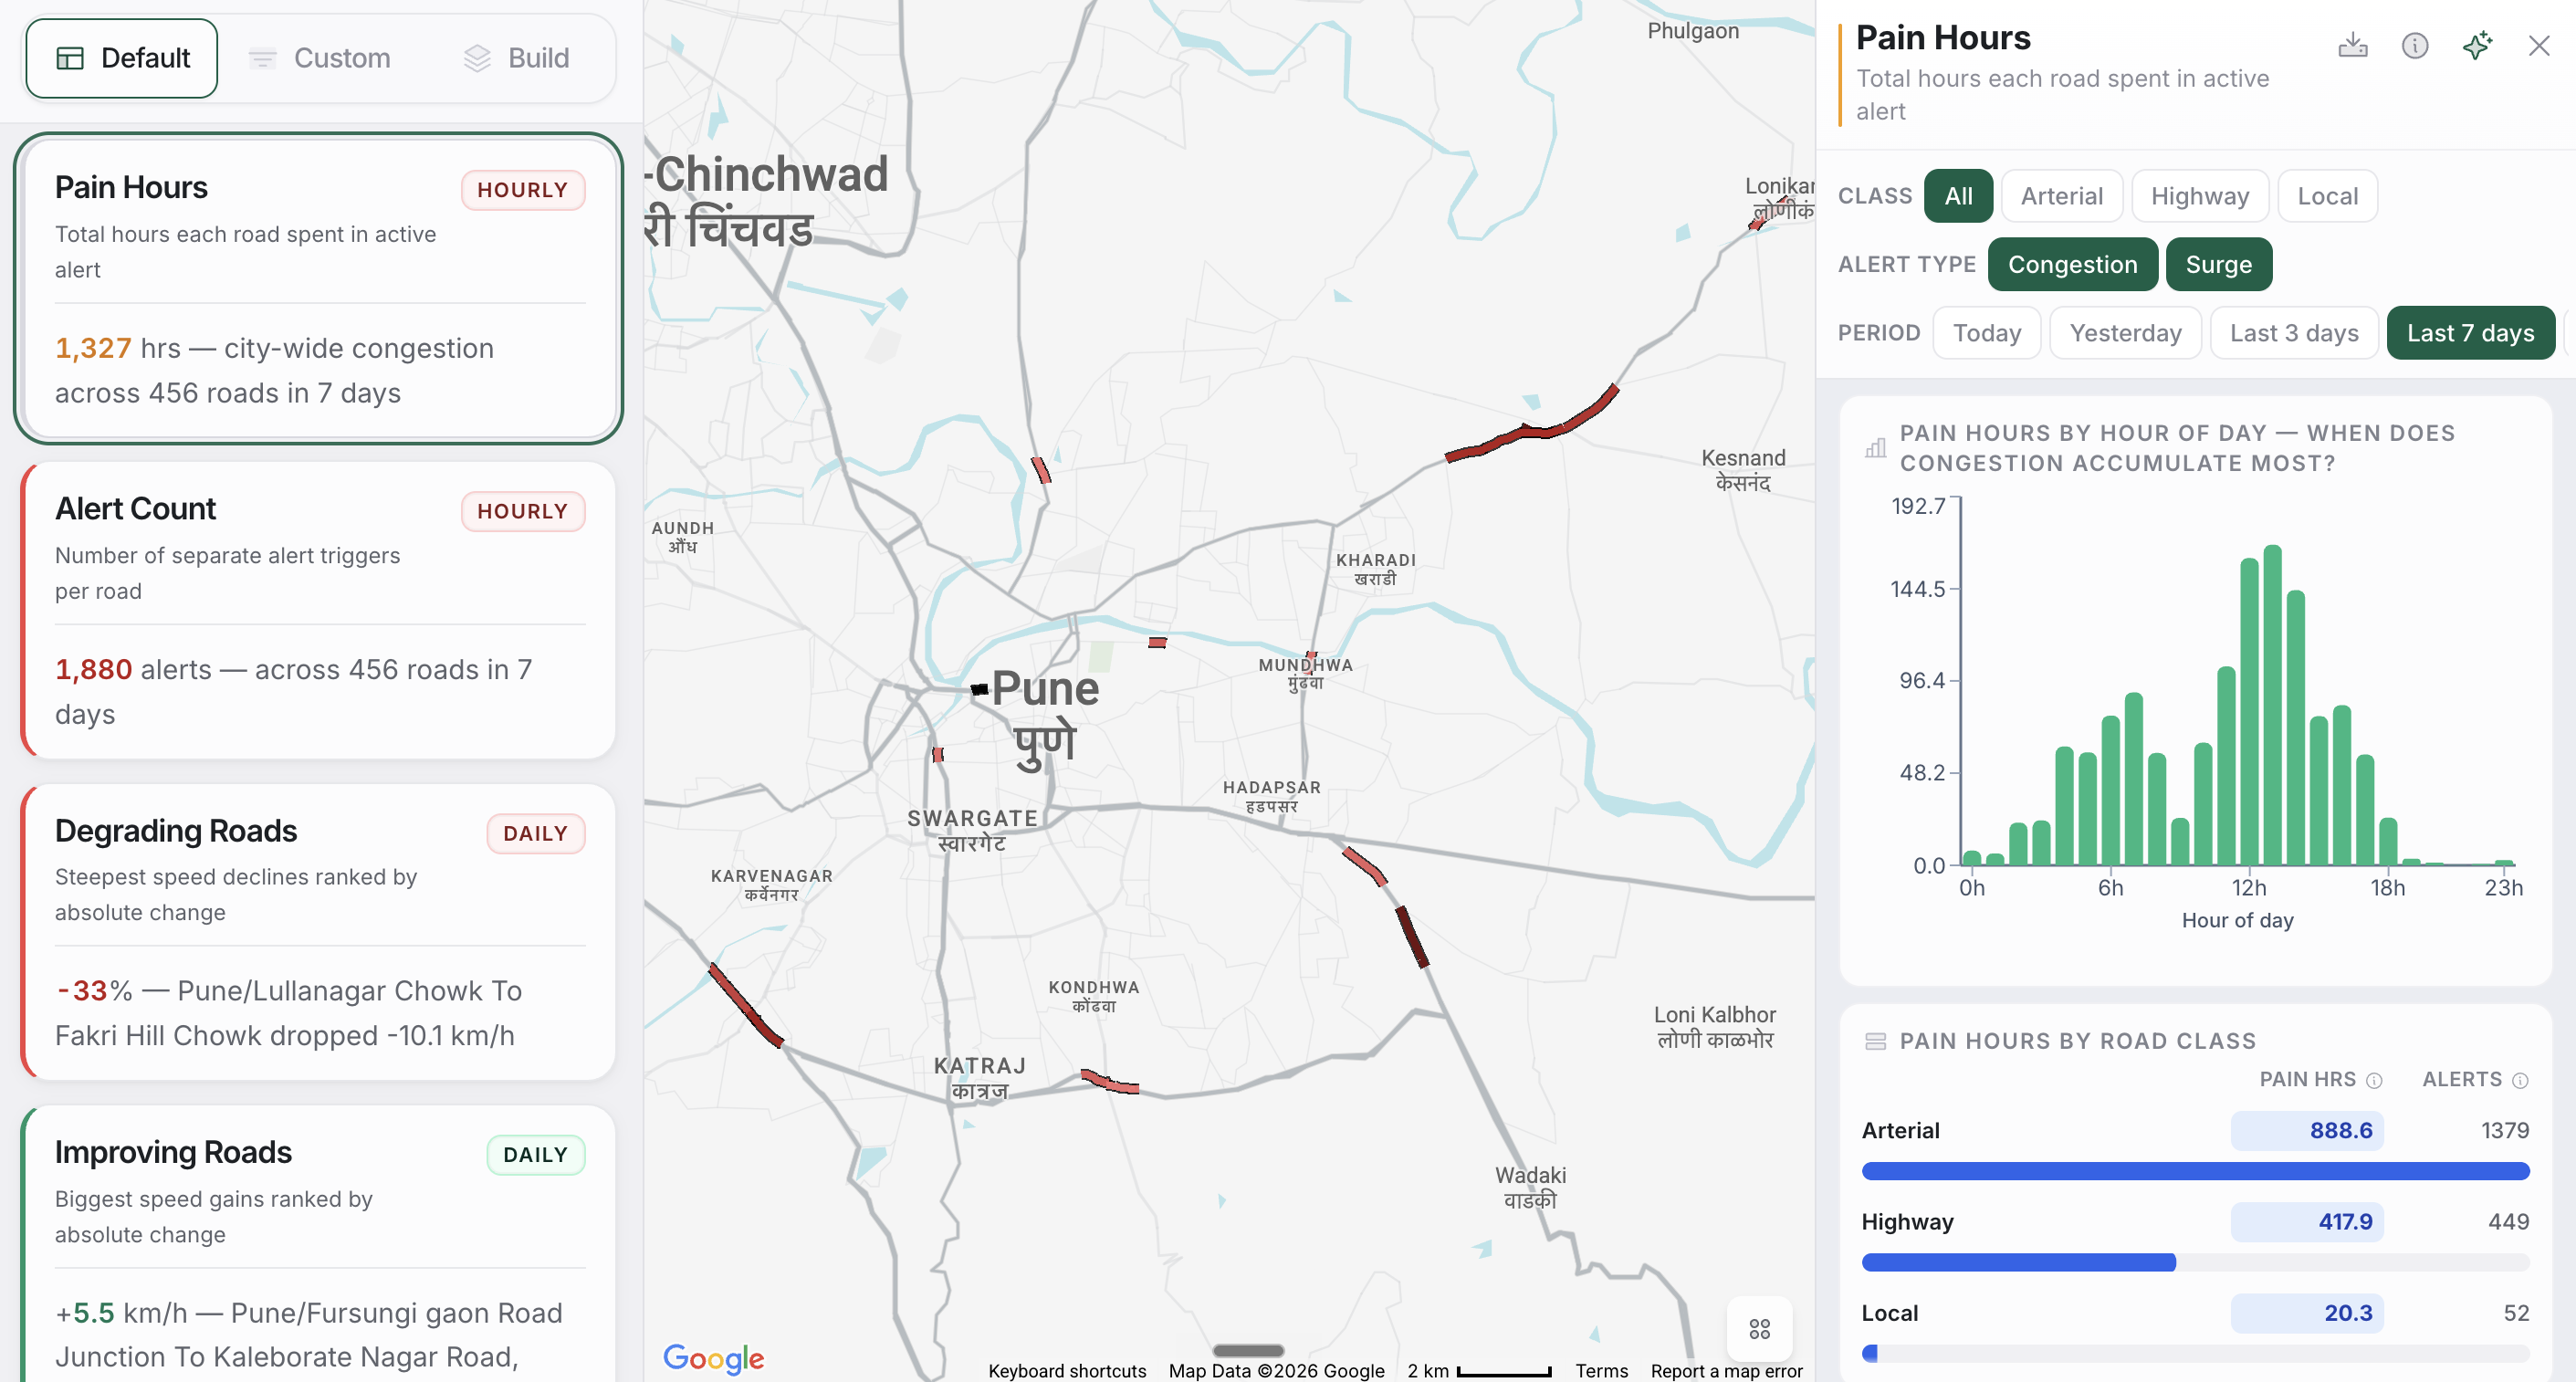
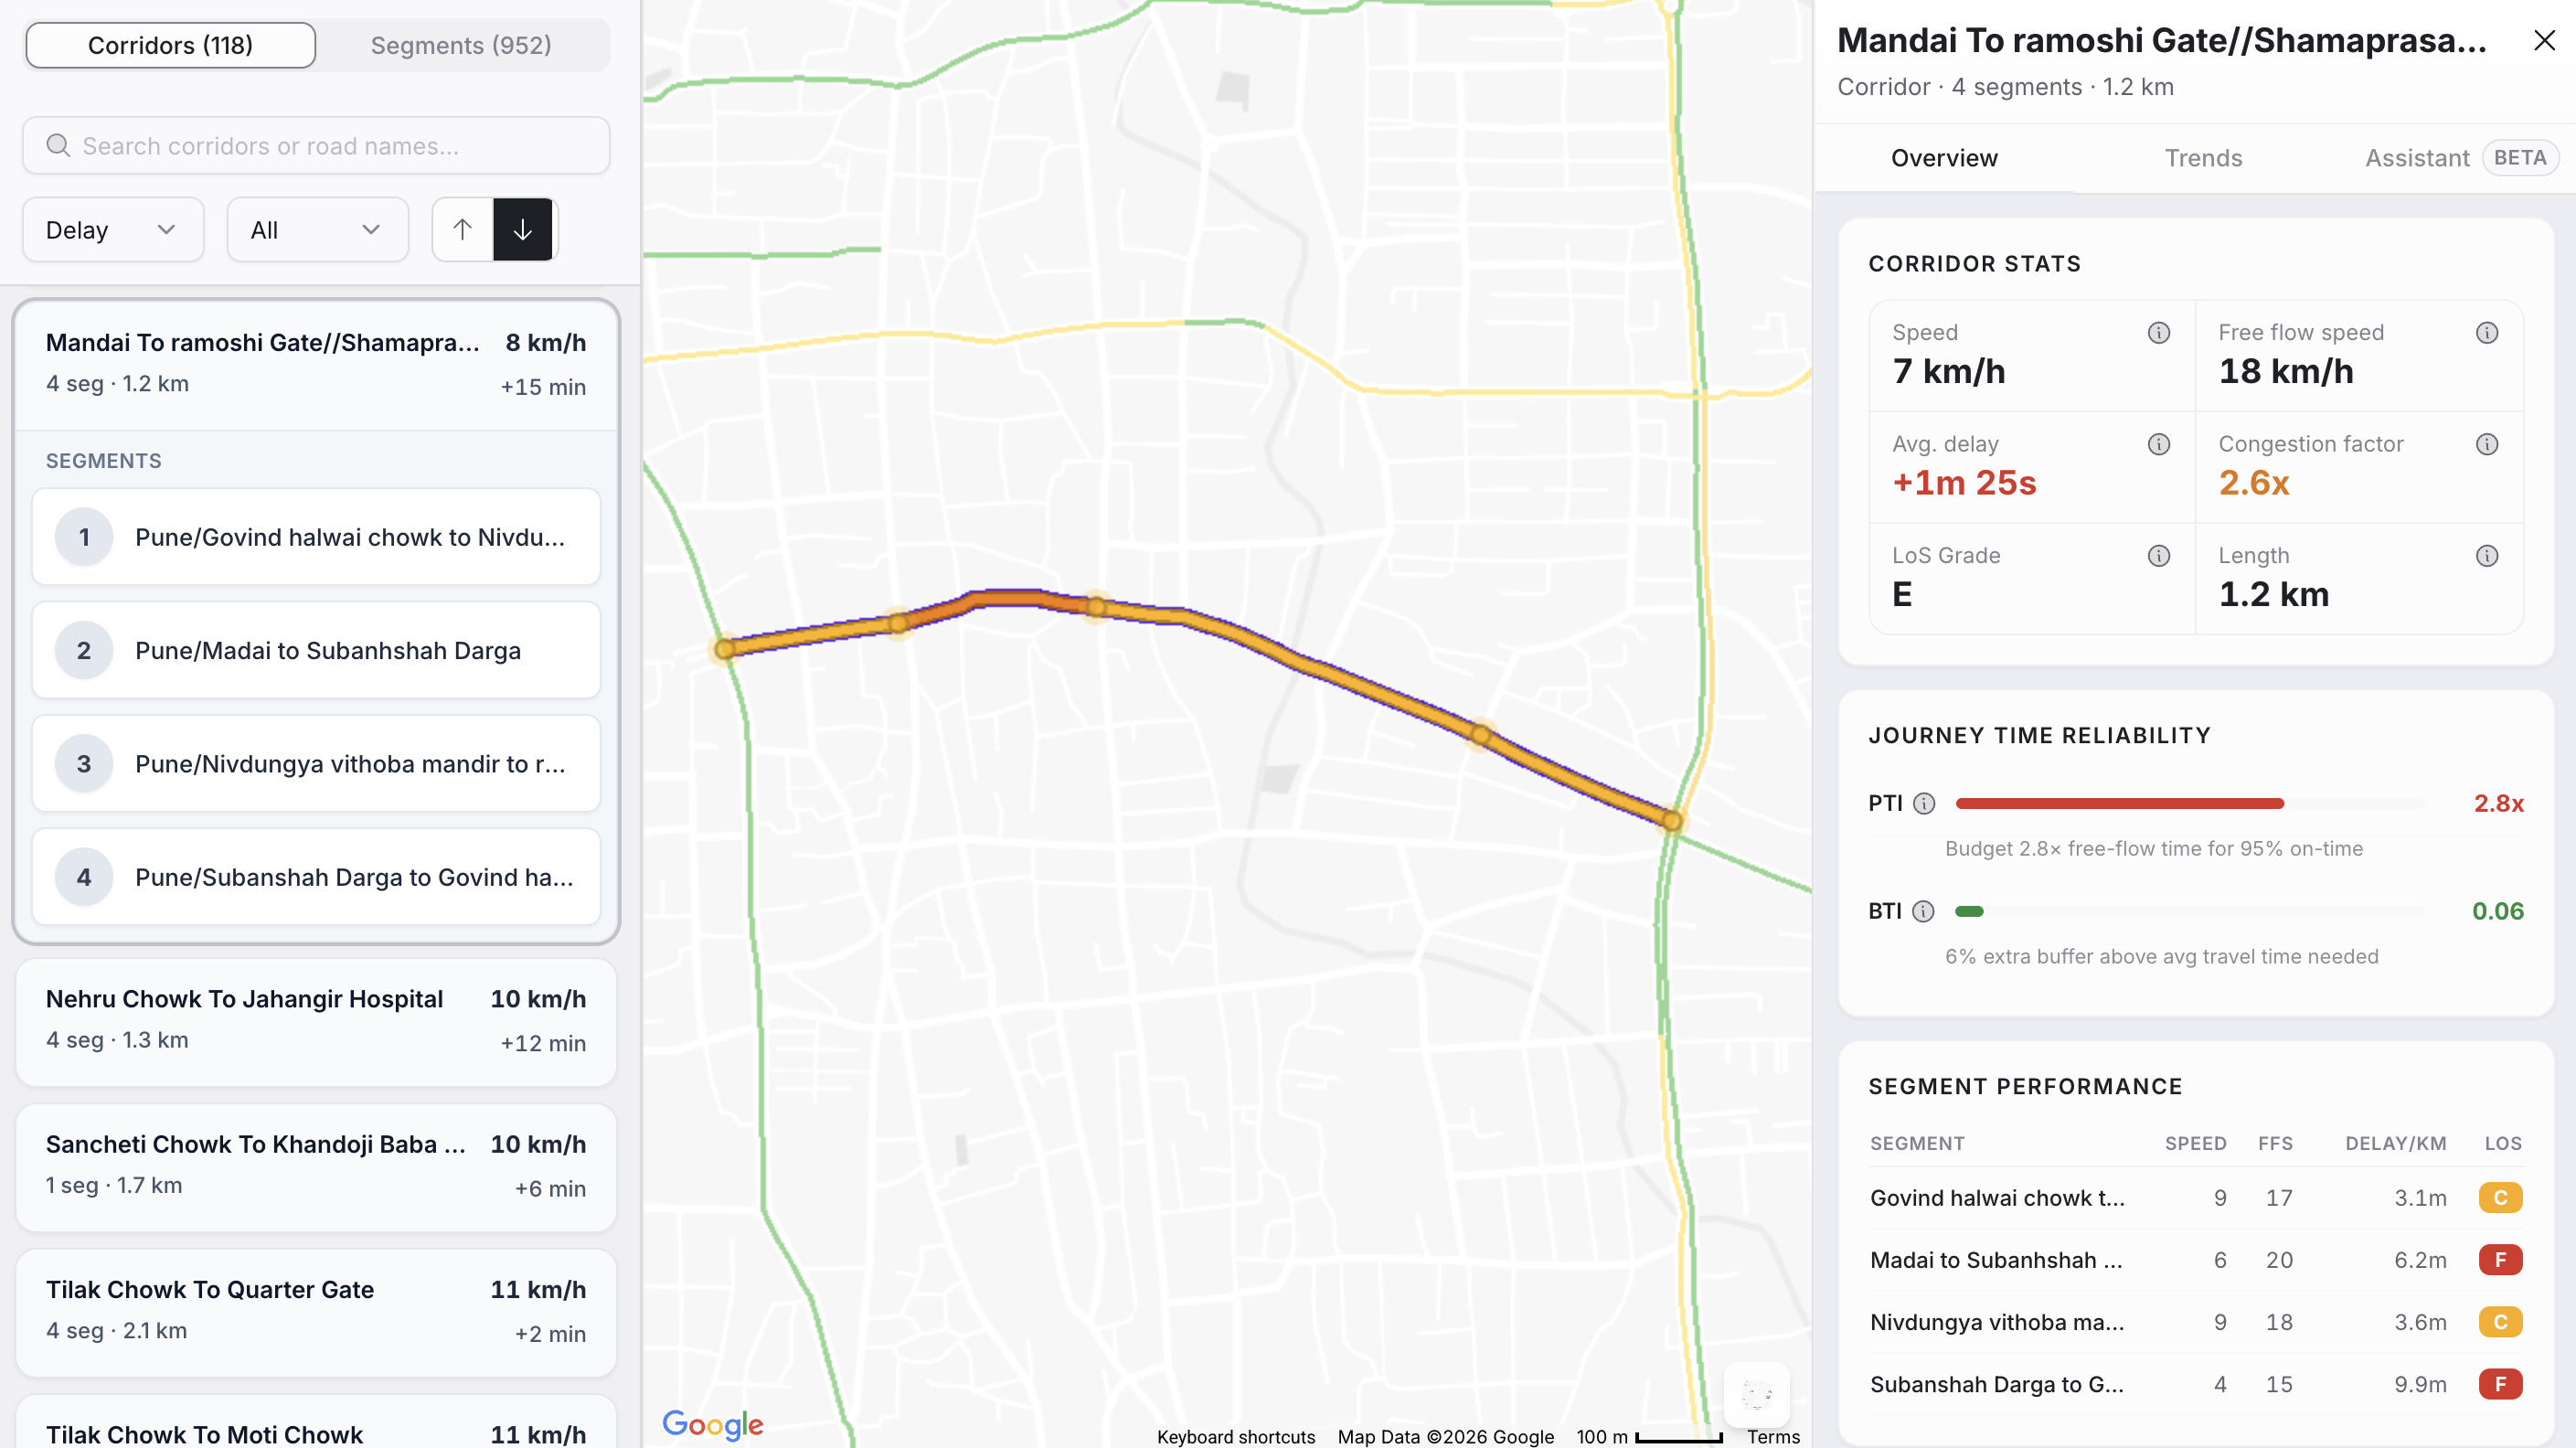
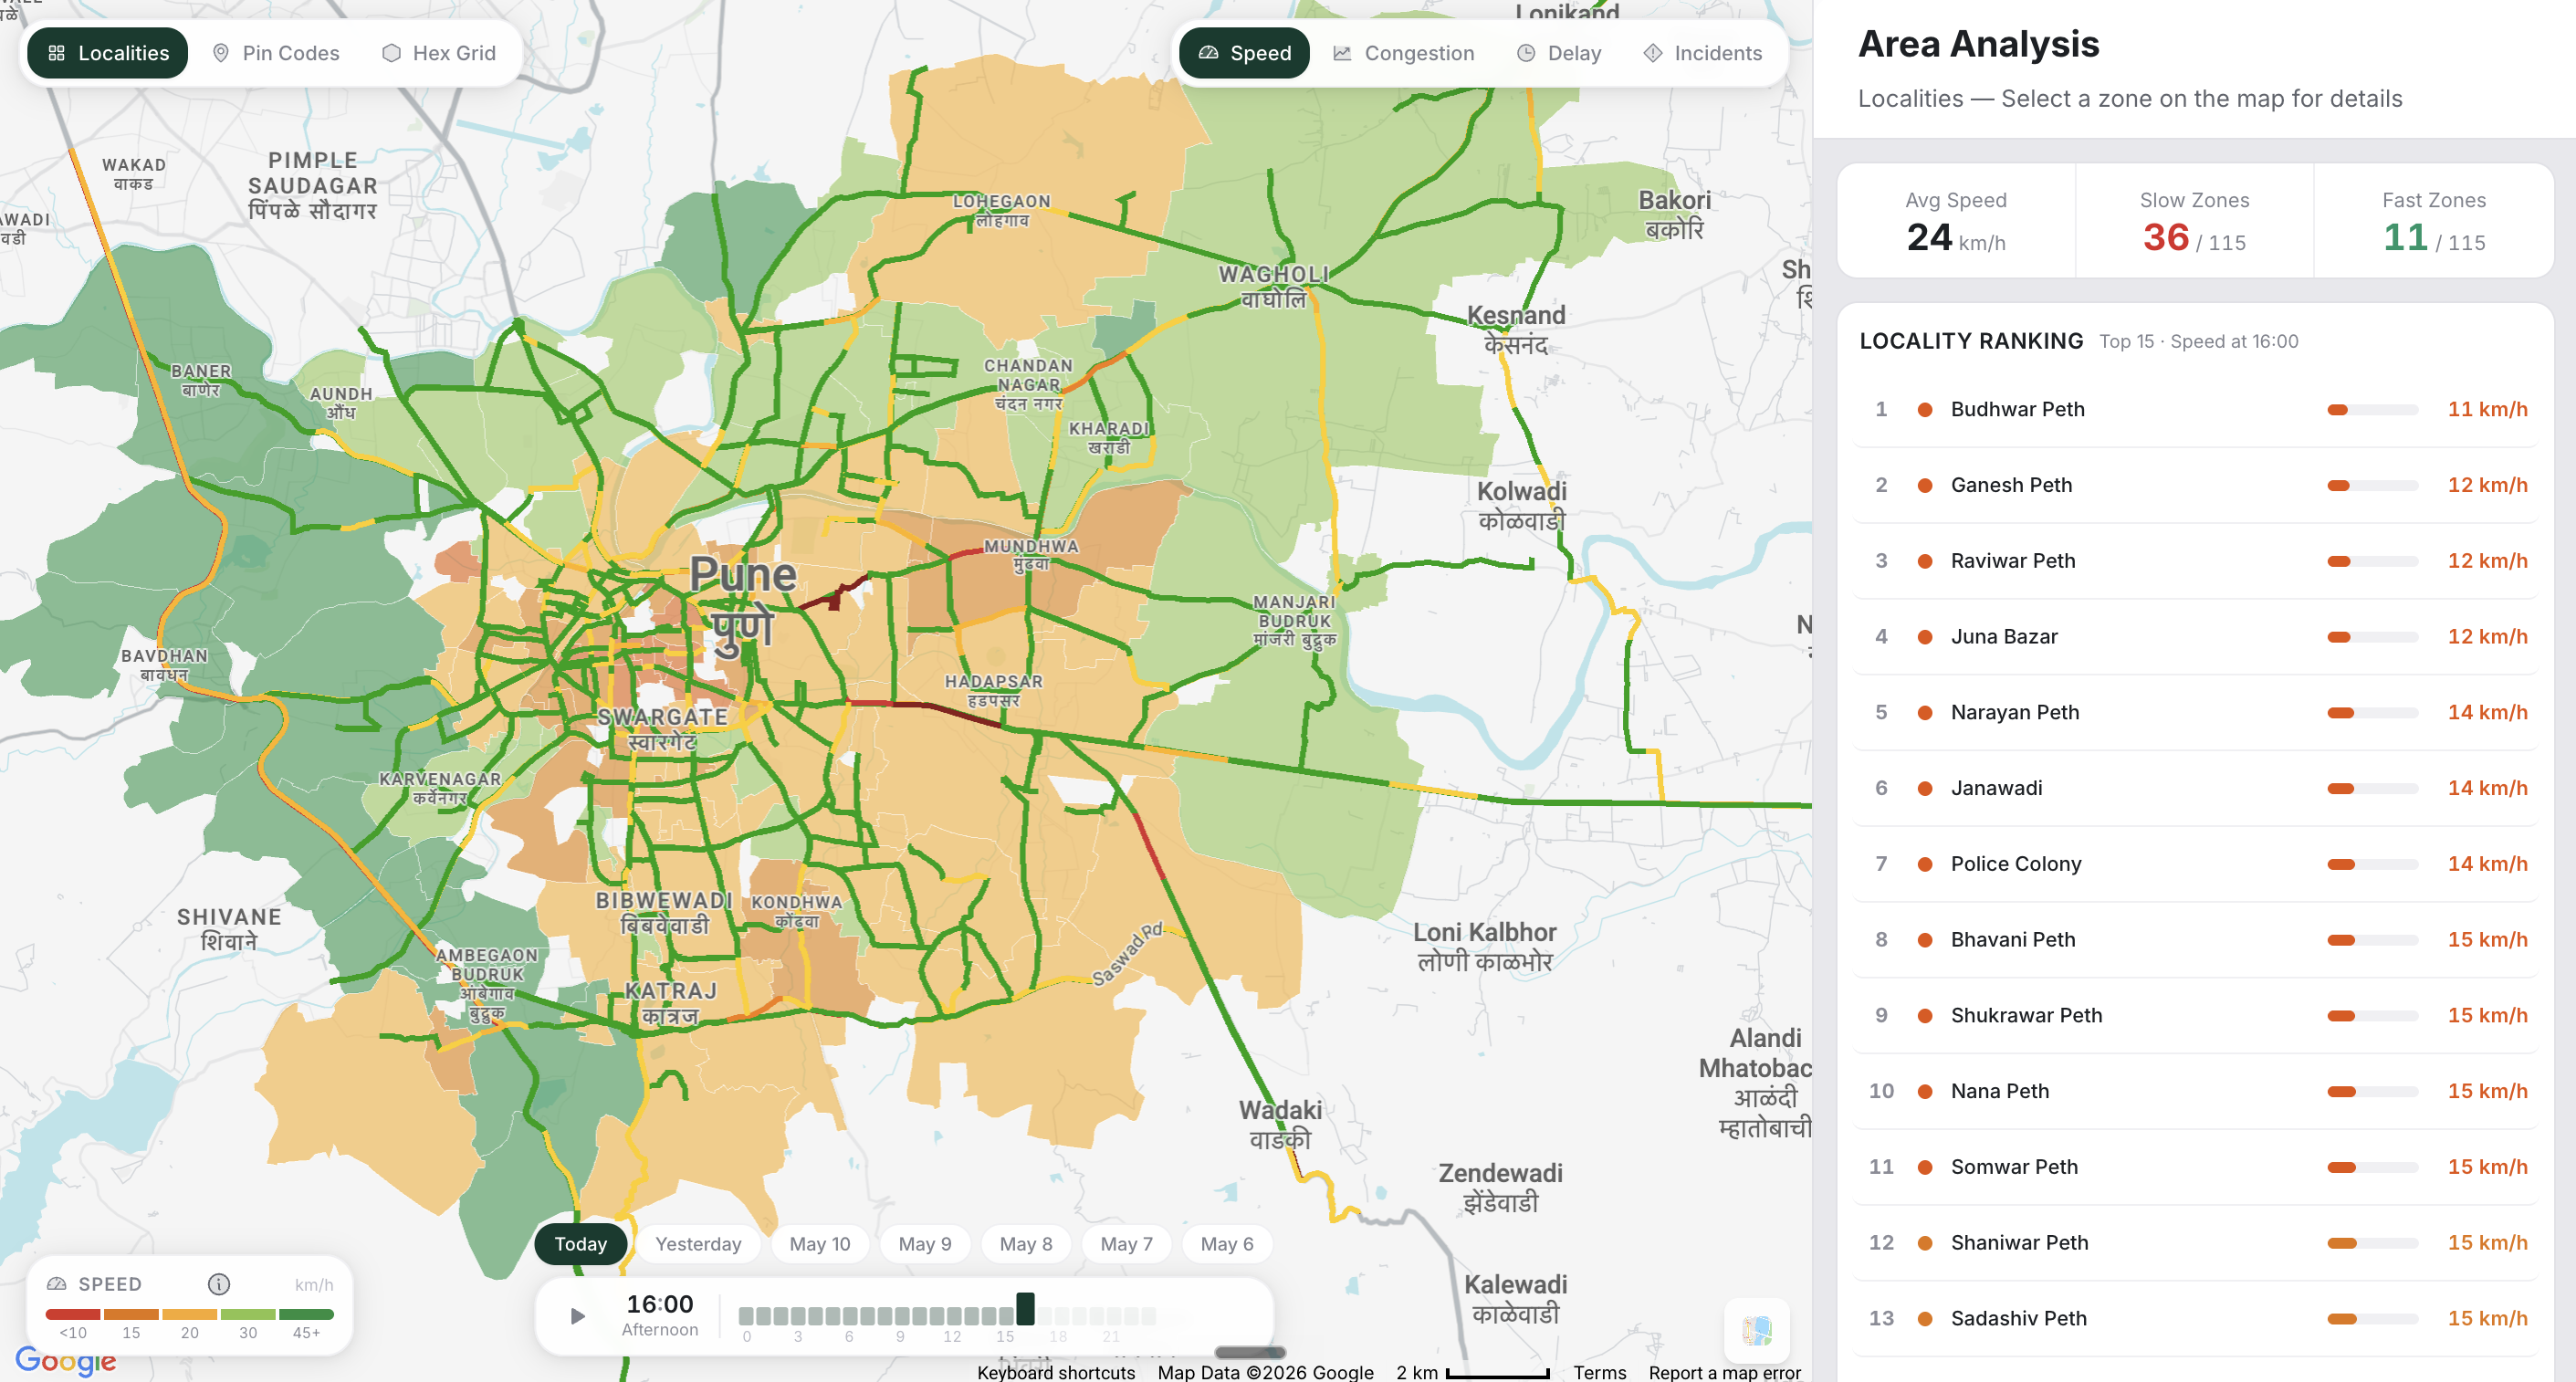
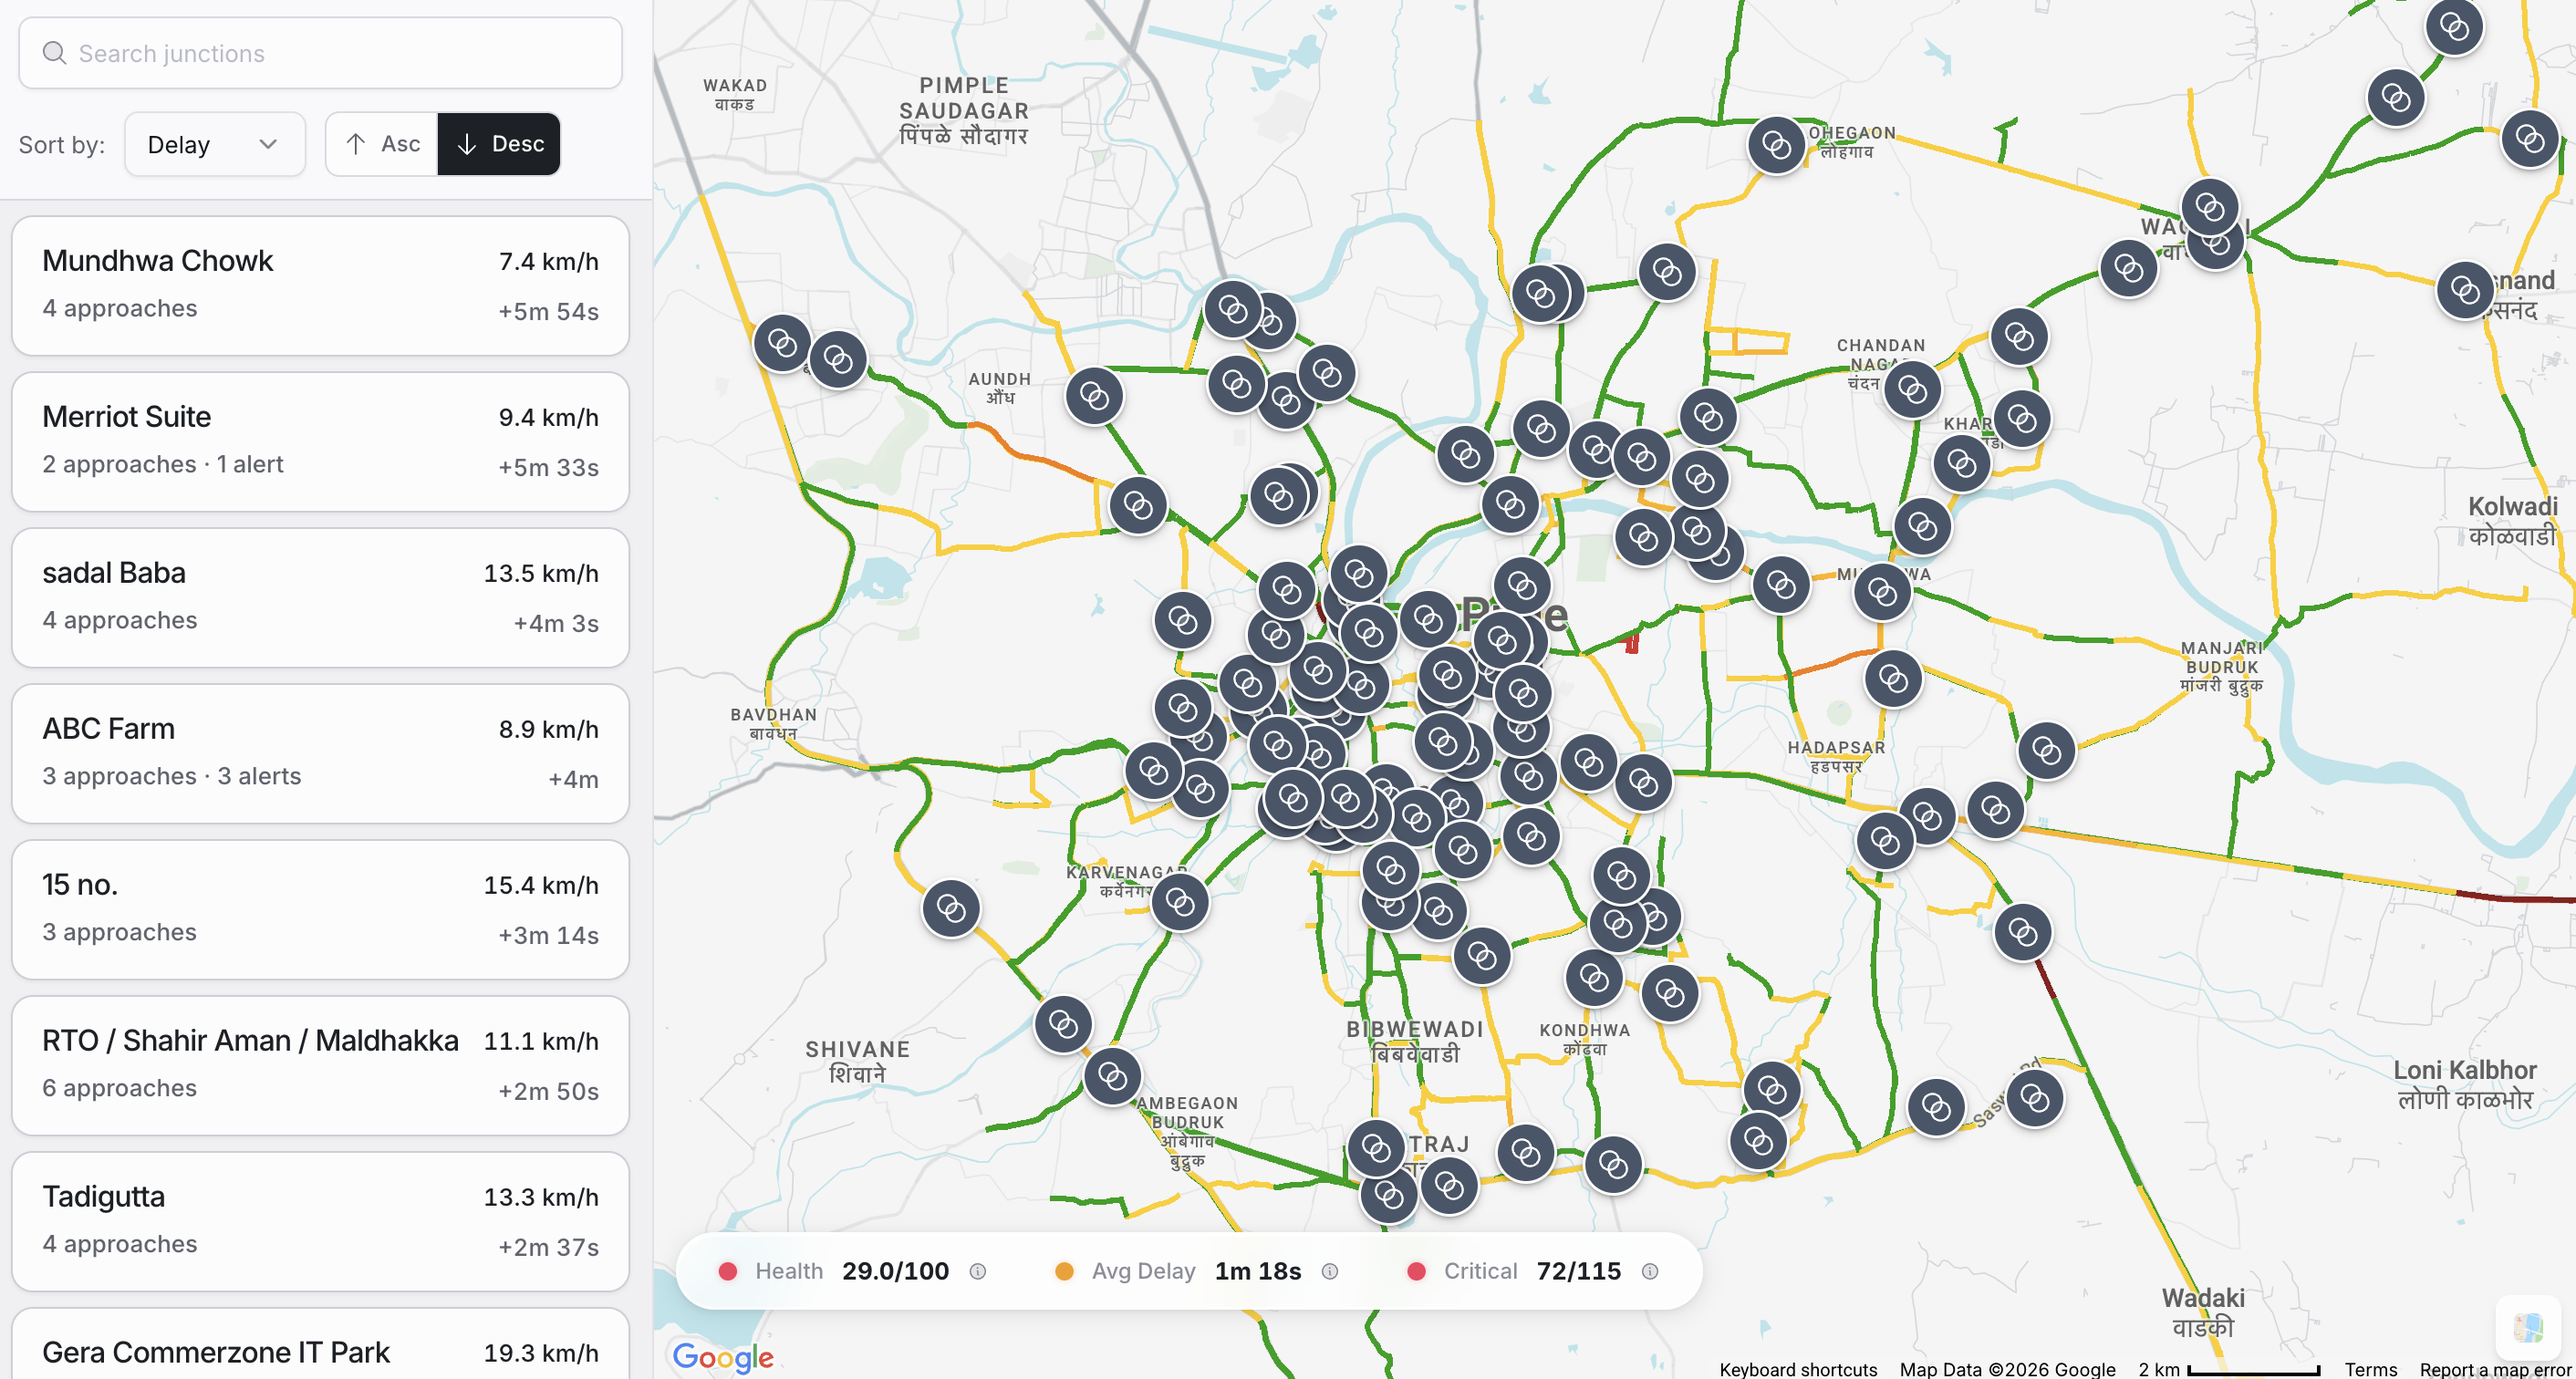
  • Congestion the moment it begins. See which corridor and junction is choking before complaints arrive.
  • Signal timing recommendations. Cycle adjustments from live traffic, not a manual survey from last year.
  • Pushes to your existing ATCS. Works alongside ATCS, VMS, and control rooms, no rip-and-replace.

Officers know where to be, and signals adapt to what is actually happening today.

Predictive field deployment

Limited personnel, deployed where they actually move the needle.

  • Forecast 15 to 30 minutes ahead. Build-up is predicted before it spills into chaos.
  • Pinpoint corridors and junctions. The exact locations that will need an officer's presence.
  • Push to control room and field. Deployment recommendations reach the dashboard and officer phones.
  • Track response and impact. Officer response times, deployment outcomes, and before and after speeds.

Deployment becomes proactive, measurable, and defensible up the chain.

Simulate closures and new infrastructure

Test the intervention on real city data before committing a single rupee of budget.

  • Simulate planned road closures. Predict where traffic spills over, and how badly, before the cones go down.
  • Model new infrastructure. Bridges, flyovers, one-ways, and lane changes, before construction.
  • Test before you commit budget. Run interventions on live and historical city data, side by side.
  • Plan diversions in advance. Communicate to citizens early and reduce surprise disruption.

Build with evidence, not assumptions, and justify every project up the chain.

Event and weather impact analysis

Every monsoon, every match, every festival, planned for, not just survived.

  • Monsoon scenarios. Predict which roads choke in heavy rain from historical wet-weather patterns.
  • Matches, concerts, and festivals. See which areas will congest when a big event happens.
  • VIP movement. Model spillover and prepare diversions before the convoy moves.
  • Prepare in advance. Deployment plans, diversions, and citizen communications, ready before the day begins.

The city goes from firefighting to forecasting.

Weighing TraffiCure against a specific vendor? See TraffiCure vs INRIX, TomTom, HERE, Kapsch, and traditional ITMS →

Frequently asked questions

The questions city teams ask most before they deploy.

Does TraffiCure require new hardware like cameras or sensors?

No. TraffiCure is 100% software. It uses anonymised speed data from Google's Roads Management Insights programme, so every smartphone on the road becomes a traffic sensor. Zero new hardware, zero installation, zero civil works.

How long does TraffiCure take to deploy in a new city?

Typical deployment is 2–3 weeks. Pune City Traffic Police went live on 100% of their road network in 3 weeks with no field work.

Which cities is TraffiCure live in?

TraffiCure is live with Pune City Traffic Police, Kolkata Police, Howrah Police Commissionerate, Bidhannagar, and Barrackpore. Expansion to additional Indian cities is ongoing.

How often is the traffic data refreshed?

Every 2 minutes, across 100% of the road network. This covers arterial roads, residential streets, and service lanes, not just highways and junctions.

Can TraffiCure integrate with our existing ITMS or command centre?

Yes. TraffiCure exposes alerts and analytics via API, and the web dashboard can run alongside existing ITMS displays. Cities typically keep their ITMS for junction enforcement and add TraffiCure for network-wide visibility.

How much does TraffiCure cost compared to a traditional ITMS deployment?

Because TraffiCure is software-only, total cost of ownership is a fraction of a camera-based ITMS, with no installation, no maintenance contracts, and no hardware replacement cycle. Book a demo for a city-specific quote.

Dive deeper

Read how TraffiCure works in practice, from city deployments to the technology behind our data pipeline. Start with our plain-English guide to Google Roads Management Insights, the feed our platform is built on.

Why 97% of your city's roads are invisible to traditional systems

Camera-based systems cover junctions. Sensor loops cover highways. But what about the other 97% of roads where congestion actually builds?

Real-time just got more real

How our 2-minute refresh cycle delivers traffic intelligence that's faster than the congestion itself.

Pune went live in three weeks

A real deployment story, from first call to full city coverage in under a month.

Request a Demo