The 1954 instrument and what comes next
Google RMI is the first genuine successor to the 1954 Detroit origin-destination survey. Every measurement tool in between was a workaround for the same missing data.
1954 Last primary instrument — Traffic Intelligence
Beginning in late 1953 and continuing through 1954, a team of surveyors fanned out across Detroit with clipboards. They knocked on tens of thousands of doors across the metropolitan area. They asked families, in carefully scripted language, where they had gone the day before, when, for what purpose, and by what mode. At the edges of the city, they set up cordon stations on every inbound highway — at twelve external points — and interviewed drivers on the roadside as they crossed the line, asking the same question on a pavement in winter that they were asking at doorsteps in a living room.
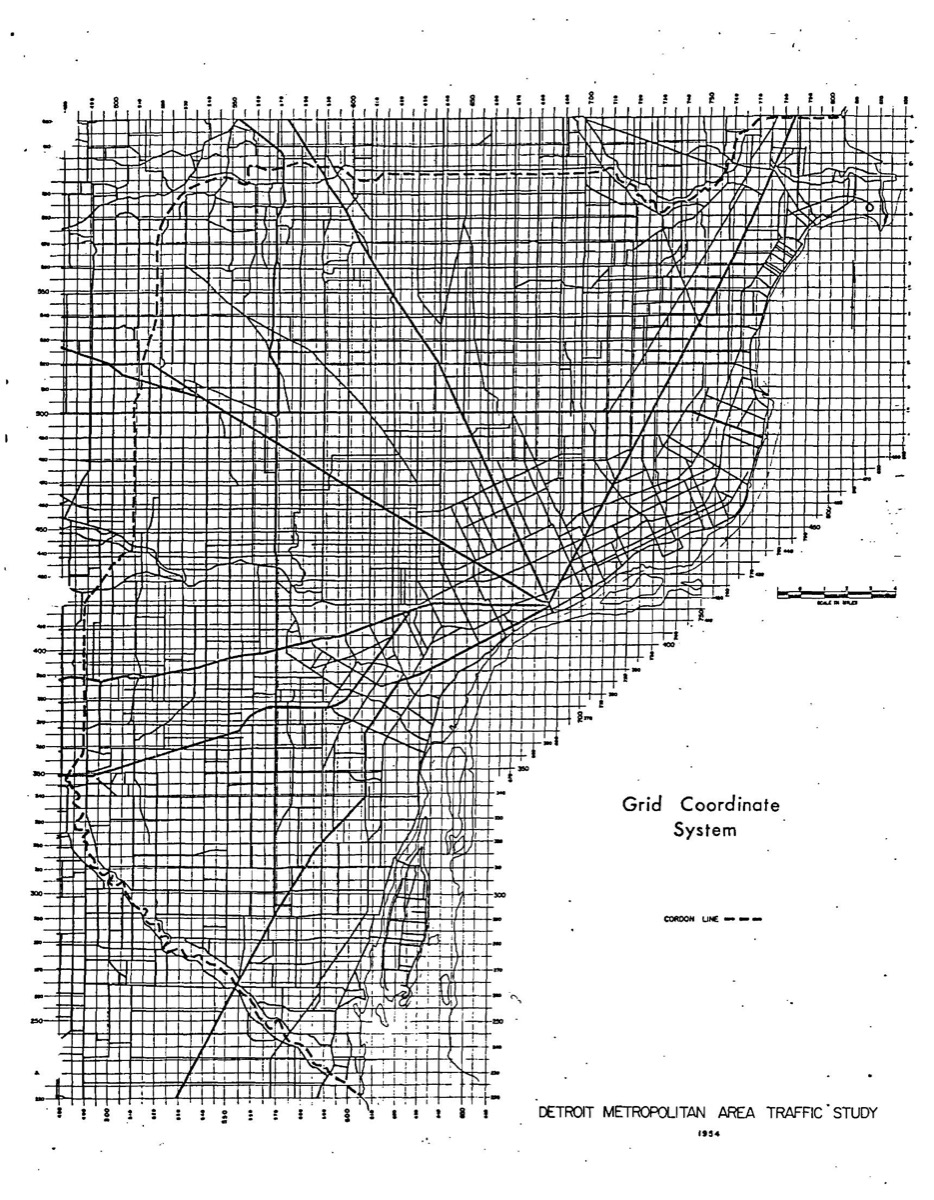 Detroit Metropolitan Area Traffic Study grid coordinate system, 1954. The outer line is the study's cordon — every road crossing it had an interview station.
The result was the Detroit Metropolitan Area Traffic Study, with the first volume published in 1955. It was the first time any city had a quantitative picture of its own movement. The method it pioneered — the home-interview origin-destination survey, paired with cordon-line roadside interviews — would dominate the practice of transport planning for the next seventy years.
Every curriculum in every planning school taught it. Every city in every country adapted it. Over the decade that followed, it crystallized into the four-step model — trip generation, trip distribution, mode choice, and assignment — the intellectual scaffolding of modern transport engineering. When a planner in São Paulo, Sydney, or Stuttgart sat down in 1975 or 2005 to forecast the effect of a new road, they were, whether they knew it or not, using a tool lineage that started in Detroit.
The Detroit study was a genuine instrument. It measured something that could not otherwise be measured. And the surprising thing — the thing worth stopping on — is that the profession never really got a replacement for it.
Until now.
Why the 1954 instrument lasted seventy years
The home-interview survey was not held onto out of nostalgia. It lasted because nothing else answered the same question.
Here is the question it answered: across an entire city, at the level of individual trips, how are people moving?
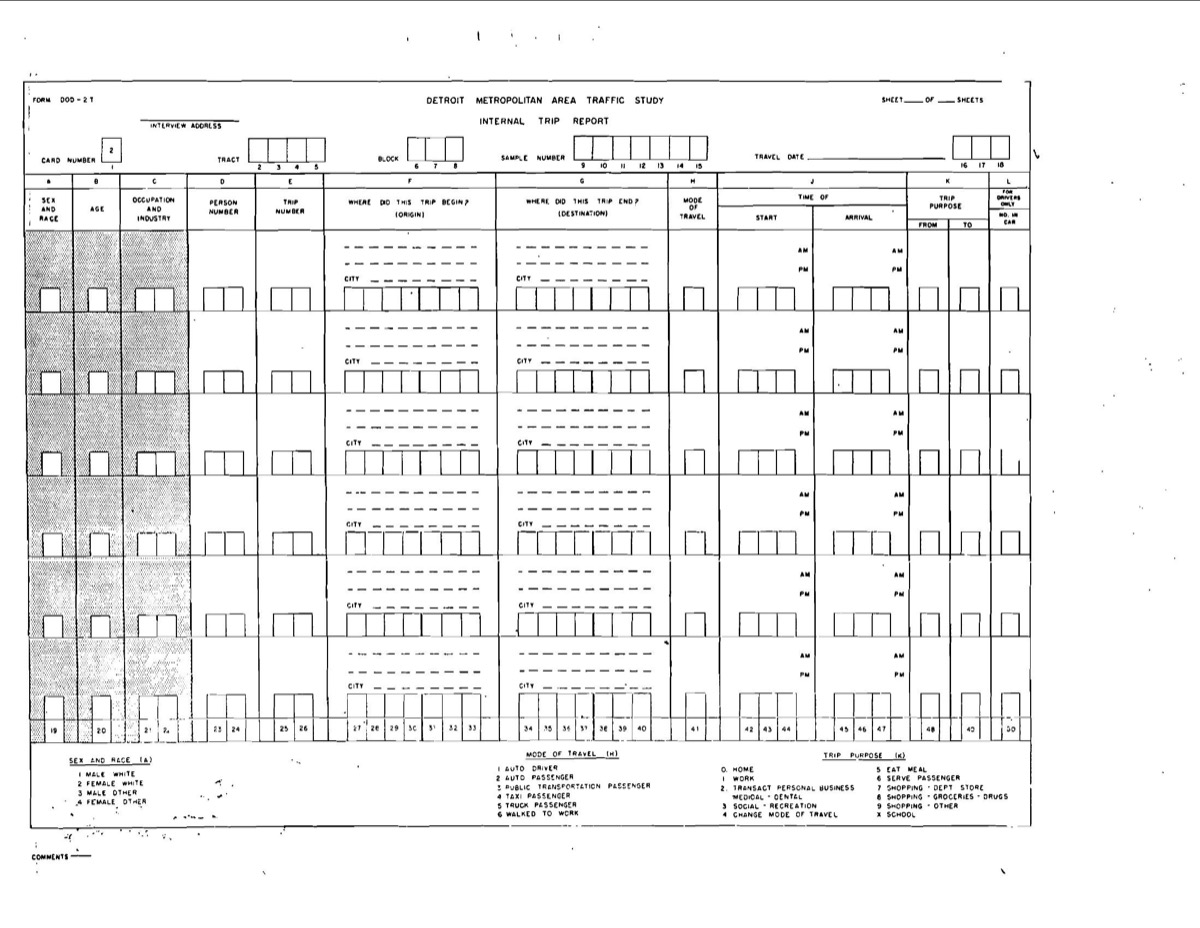 Form DOD-27 — the internal trip report clipboard surveyors filled out at each interviewed household. Columns for sex, age, occupation, trip origin, trip destination, time, mode, and purpose.
Every tool invented between 1954 and 2024 answered a narrower question.
SCATS in Sydney — piloted on eight intersections in the Central Business District in 1963 and in commercial operation by 1975 — and SCOOT in the United Kingdom, first deployed in Maidstone in 1980, were breakthroughs. They introduced adaptive signal control using inductive loops at intersections. But they measured what happened at a junction. They did not tell a planner how a trip started, where it ended, or what share of the network it used.
Freeway loop detectors, installed widely through the 1980s and 1990s, counted volumes at fixed points. Variable message signs relied on them. But a loop at kilometre twelve does not know about kilometre eleven.
Automatic number plate recognition had a longer run-up than most planners remember. Invented by the United Kingdom's Police Scientific Development Branch in 1976, prototyped on the A1 and the Dartford Tunnel by 1979, scaled into the "Ring of Steel" around the City of London in 1993, and absorbed into civic traffic systems through the 1990s and 2000s. A pair of cameras could compute the travel time between them. That was a real leap — corridor-level measurement. But it required camera infrastructure at every pair of points, and it could not tell you where the vehicle went between those cameras. Bluetooth and Wi-Fi MAC matching did a similar thing at lower cost. Toll-tag matching worked where there were toll tags. Each new sensor added another small, precise, point-shaped answer to a city-shaped question.
Then, through the 2010s, came the probe-data era. Companies like INRIX, TomTom, and HERE aggregated GPS traces from a sample of in-car and phone users and packaged them as a commercial feed. This was the closest any product had come to a network-wide view — and for two decades it was the state of the art.
But it was still a sample. A small, weighted, opaque sample, with structural biases — toward highways, toward certain device types, toward daytime commuters. Most of the world's cities still ran a home-interview survey every five to ten years because no probe feed covered the local-road layer densely or honestly enough to plan from.
The result, if you zoom out, was a patchwork. Every city built its transport plan from one 1954-style survey refreshed occasionally, plus a scatter of point sensors, plus a sample probe feed that worked for freeways and struggled on neighbourhood streets. The planner stitched these together by hand. Every intermediate instrument filled a gap. None of them replaced the primary one.
"The constraint was never the model. It was always the data. The model was elegant; the data was scarce and slow."
The sampling ceiling
It is worth being precise about why probe data — as good as it got — was never going to replace the 1954 survey.
A probe dataset is, by construction, a sample of devices. The larger the sample, the better the picture; but the sample is always weighted by whatever determines the device's presence — vehicle type, user demographic, whether navigation is actively running, whether the road is popular enough to attract navigating users in the first place.
On a major arterial at rush hour, these biases are small and the picture is useful. On a residential street at ten in the evening, the sample may be too thin to say anything at all. On a newly opened road, the sample is zero until enough navigating drivers discover it.
This is the sampling ceiling. It is not a bug in any vendor's product. It is a property of every sample-based measurement, regardless of sample size. And it is the reason cities kept paying for expensive household surveys alongside probe data for thirty years: the probe showed the loud part of the network, and the household survey was the only way to know the quiet part existed.
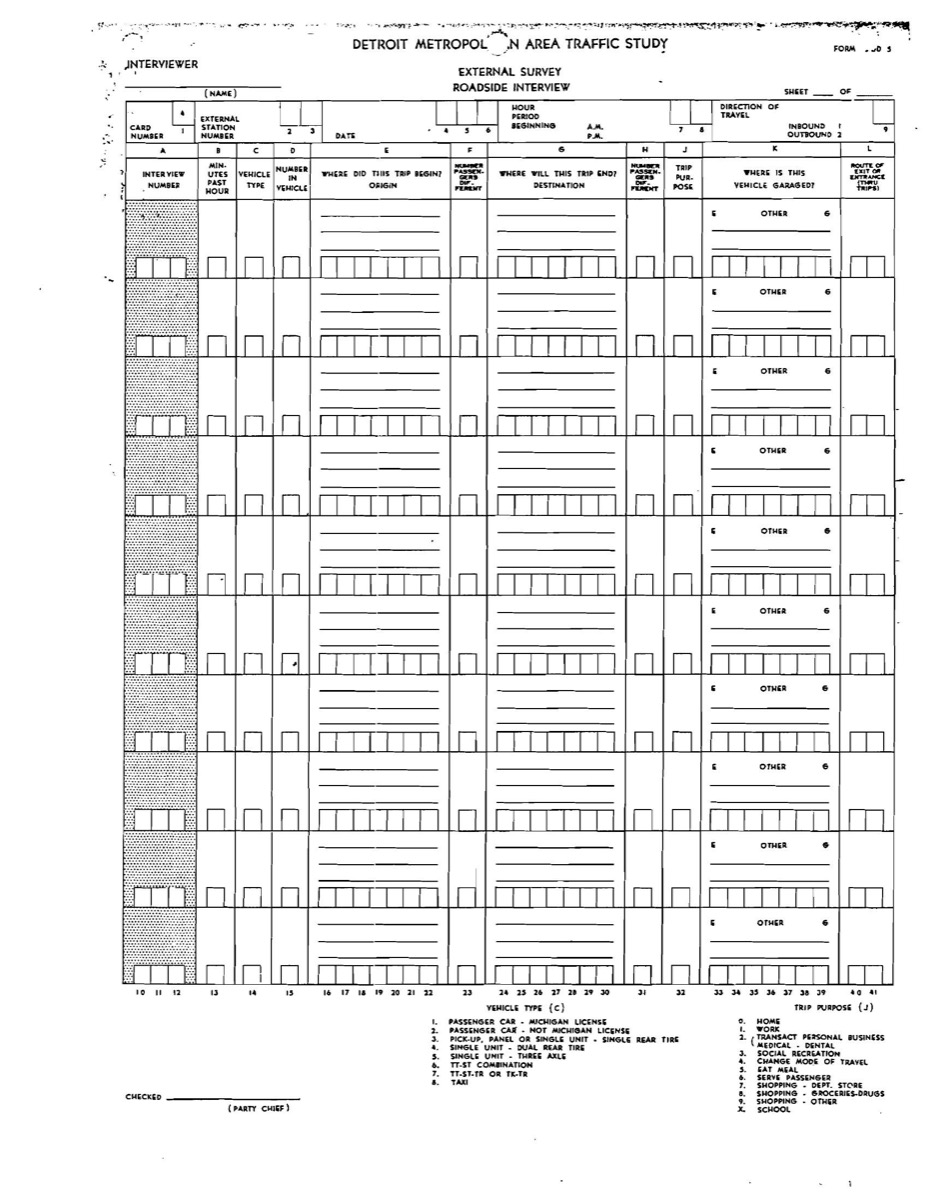 The roadside interview form used at Detroit's cordon stations. Every inbound driver got stopped and asked where the trip began, where it would end, and the purpose. Seven decades later, we are still trying to answer the same questions — now from the passive data our phones already emit.
The architecture of the 1954 instrument was survey-plus-model. You measured what you could, and you modelled the rest. That architecture was so deeply baked into the profession that most planners working today have never planned any other way.
What Google RMI actually changed (and what it didn't)
On August 25, 2025, Google released Roads Management Insights — RMI. The press framed it as a new traffic data product and moved on.
It is tempting to describe RMI as the first "census" of a city's movement, in contrast to earlier probe feeds that were mere samples. That framing is too glib and does not survive scrutiny. RMI is also a sample. Every GPS-based traffic product in existence is a sample. What changed in 2025 is not that sampling ended. It is that three things happened at once, and the combined effect crossed a threshold.
First, the pool changed. INRIX, TomTom, and HERE draw most of their data from embedded-navigation SDKs, connected-car telematics, and commercial fleet systems. These are, by construction, commercial, commuter-shaped, and highway-biased populations. The sample is drawn from a pool that is already unrepresentative of how cities actually move. RMI draws from Android Location Services and Google Maps — a pool much closer to "anyone with a smartphone and location turned on." Same method, different population, and the population is roughly an order of magnitude larger and far less biased by vehicle type.
Second, the density rose. At one billion-plus devices, a typical urban arterial at rush hour sees thousands of observations per minute. A residential street at ten in the evening still sees enough to compute a speed honestly. Below a certain sample density, every dataset has blindspots — streets that do not register, hours that do not show up, roads so new the sample has not found them yet. RMI is the first probe feed where, for most planning questions, the thin spots thin out enough that a city can stop working around them.
This is not unconditional. RMI applies k-anonymity thresholds to protect user privacy — segments that stay persistently low-volume across several quarters drop out of publication entirely. A handful of truly deserted streets will not register, by design. But for the overwhelming majority of a city's roadspace, across the overwhelming majority of its operating hours, the signal is there to be read. Compared with a five-yearly household survey or a probe feed that only saw the commuter layer, this is a different universe of coverage.
Third, the delivery changed. RMI arrives as a warehouse dataset, refreshed every two minutes, covering every segment of every road in every city it serves. A city does not call an API and ask "how fast is Road X right now." A city queries the dataset and asks "show me every road in the network that behaved differently on Fridays between six and seven in the evening, across the last ninety days." Those are questions a conventional probe feed cannot answer, because they require the whole network at once rather than one road at a time.
None of these three changes is, on its own, a categorical leap. Together they cross a threshold. In signal processing there is a density above which a sampled signal can be reconstructed without loss; below it, you are guessing. The earlier probe era sat below that threshold for residential streets, off-peak hours, and new construction — which is why cities kept paying for five-yearly household surveys alongside their probe subscriptions. RMI is the first probe product dense enough, drawn from a representative enough pool, that the old workarounds — stitching sample probe data together with home-interview surveys, patching neighbourhood streets with cameras, pretending the off-peak did not exist — are no longer needed.
So the claim is not that RMI is a census in the literal sense. It is not. The claim is narrower and more durable: RMI is a sample that has crossed the density at which a planner can plan from it alone, across a whole city, including the quiet streets and the quiet hours. That is a subtler statement than "census." It is also the one that actually matters.
The questions that were unanswerable, and now aren't
The test of a new instrument is not what it automates. It is what it lets you know that you could not previously know. Three questions, out of many, illustrate the shift.
Does widening this road reduce congestion, or does it generate traffic? Induced demand — the idea that adding road capacity can increase total driving — has been a live debate in transport economics since the 1960s. The debate survived this long because no one had clean before-and-after network data. With RMI, the question becomes a measurement. Take one corridor, measure the ninety days before a capacity change and the ninety days after, look at the whole surrounding network, and read the answer. The question is no longer whether induced demand is real. It is how much of it happens where.
How much of the network is structurally broken, versus simply peak-congested? A peak-congested road is slow at six in the evening and fine at two in the afternoon. A structurally broken road is slow whenever people use it — a chronic bottleneck, a misaligned signal, a geometry the city has not yet admitted is failing. The two require different interventions and different budgets. Until a city can see free-flow speed and actual speed for every segment, every hour, every day, it cannot reliably tell them apart. Pune's network, when measured this way, contains one hundred thirty-five roads — about sixteen per cent of the instrumented network — operating below fifteen kilometres per hour. Not in the evening peak. Median. That number did not exist in 2024. It was not unknowable; it was simply unmeasured.
Is the morning peak moving earlier? Across most large cities, the answer seems to be yes — but "seems" is the operative word. Peak-spreading has been hypothesised for years. With a continuous time-series dataset, it becomes a read. Pull the same corridor, same weekday, across three years, and the shape of the peak tells you. This is the kind of slow-moving finding that reshapes infrastructure policy — and until this year, no city had the instrument to answer it cleanly.
There are dozens more. The point is not any individual question. It is that an entire class of questions — network-wide, time-resolved, continuous — moved from "estimate with a model" to "check the data" in a single year.
What a transport plan looks like when you can see everything
The 1954 instrument shaped the form of a transport plan. A plan was a forecast: here is what we expect to happen; here is what we will build to handle it; come back in five years and we will forecast again.
The instrument of 2025 changes what a plan can be.
A plan can now be a dashboard — something that says, at any moment, how the city is performing against the interventions it has chosen. Not a forecast but a live measurement.
A plan can be experimental. A city can change one signal, one bus priority lane, one school-zone timing, and know within a week whether the change worked — across the whole network, not just the corridor where the change was made.
A plan can be transparent. Citizens can see the same data the engineers see. Public debates about whether a road is "really" congested become checkable.
A plan can be cumulative. Because the data is continuous, every intervention's effect stays in the record. The city builds institutional memory in numbers, not in meeting notes.
None of this means the four-step model vanishes. Good models do not die; they get better primary data. But a profession that had, since the Eisenhower administration, been forecasting from small samples can now start auditing from full measurement. That is the shift.
Detroit, and what comes next
When the Detroit team knocked on the tens-of-thousandth door across 1953 and 1954, they were not doing market research. They were inventing the idea that a city could know itself. Every planner for the next seventy years inherited that idea and worked within its constraints.
The constraint was never the model. It was always the data. The model was elegant; the data was scarce and slow. A profession organised itself around that scarcity, and its best tools — SCATS, SCOOT, ANPR, probe feeds — were brilliant workarounds for one fact: you could not see the whole network at the same time.
In 2025, you can.
Cities that understand that will spend the next decade finding out what their networks actually do, not what a five-year-old survey estimated them to do. The ones that move first will reshape what a transport plan is for.
The last primary instrument arrived in 1954. The next one just did.
Frequently asked
When was Google RMI launched?
25 August 2025. It is Google's first public-sector traffic data product, delivered through BigQuery, Pub/Sub, and a Roads Selection API.
Is RMI a census of every vehicle?
No. RMI is still a sample, like every GPS-based traffic product. It also applies k-anonymity privacy thresholds, which means persistently low-volume segments drop out of publication. The argument this article is making is not that RMI is a census — it is that the sample has finally crossed the density at which a city can plan from it alone, across the whole network.
How does TraffiCure relate to Google RMI?
TraffiCure is a decision and analysis layer built on top of Roads Management Insights. RMI provides the continuous signal; TraffiCure turns it into the specific measurements and alerts planners use — structural-bottleneck detection, before-and-after intervention analysis, peak-pattern tracking, and network-wide anomaly surfacing — without a city needing its own data science team to write queries against BigQuery. Book a live demo to see it running on your own city's network.
TraffiCure is built on Google's Roads Management Insights. We turn the continuous network signal into the decisions planners actually need to make — before the next camera, the next corridor, or the next five-year survey.
TraffiCure delivers real-time traffic intelligence for every road in your city — no cameras, no sensors, no construction. See all features or book a demo to see your city's data.